
We’re excited to release a new reporting tool to help you aggregate and analyze trends from all over Planning Center. We’re calling it Metrics, and it’s available today in Planning Center People.
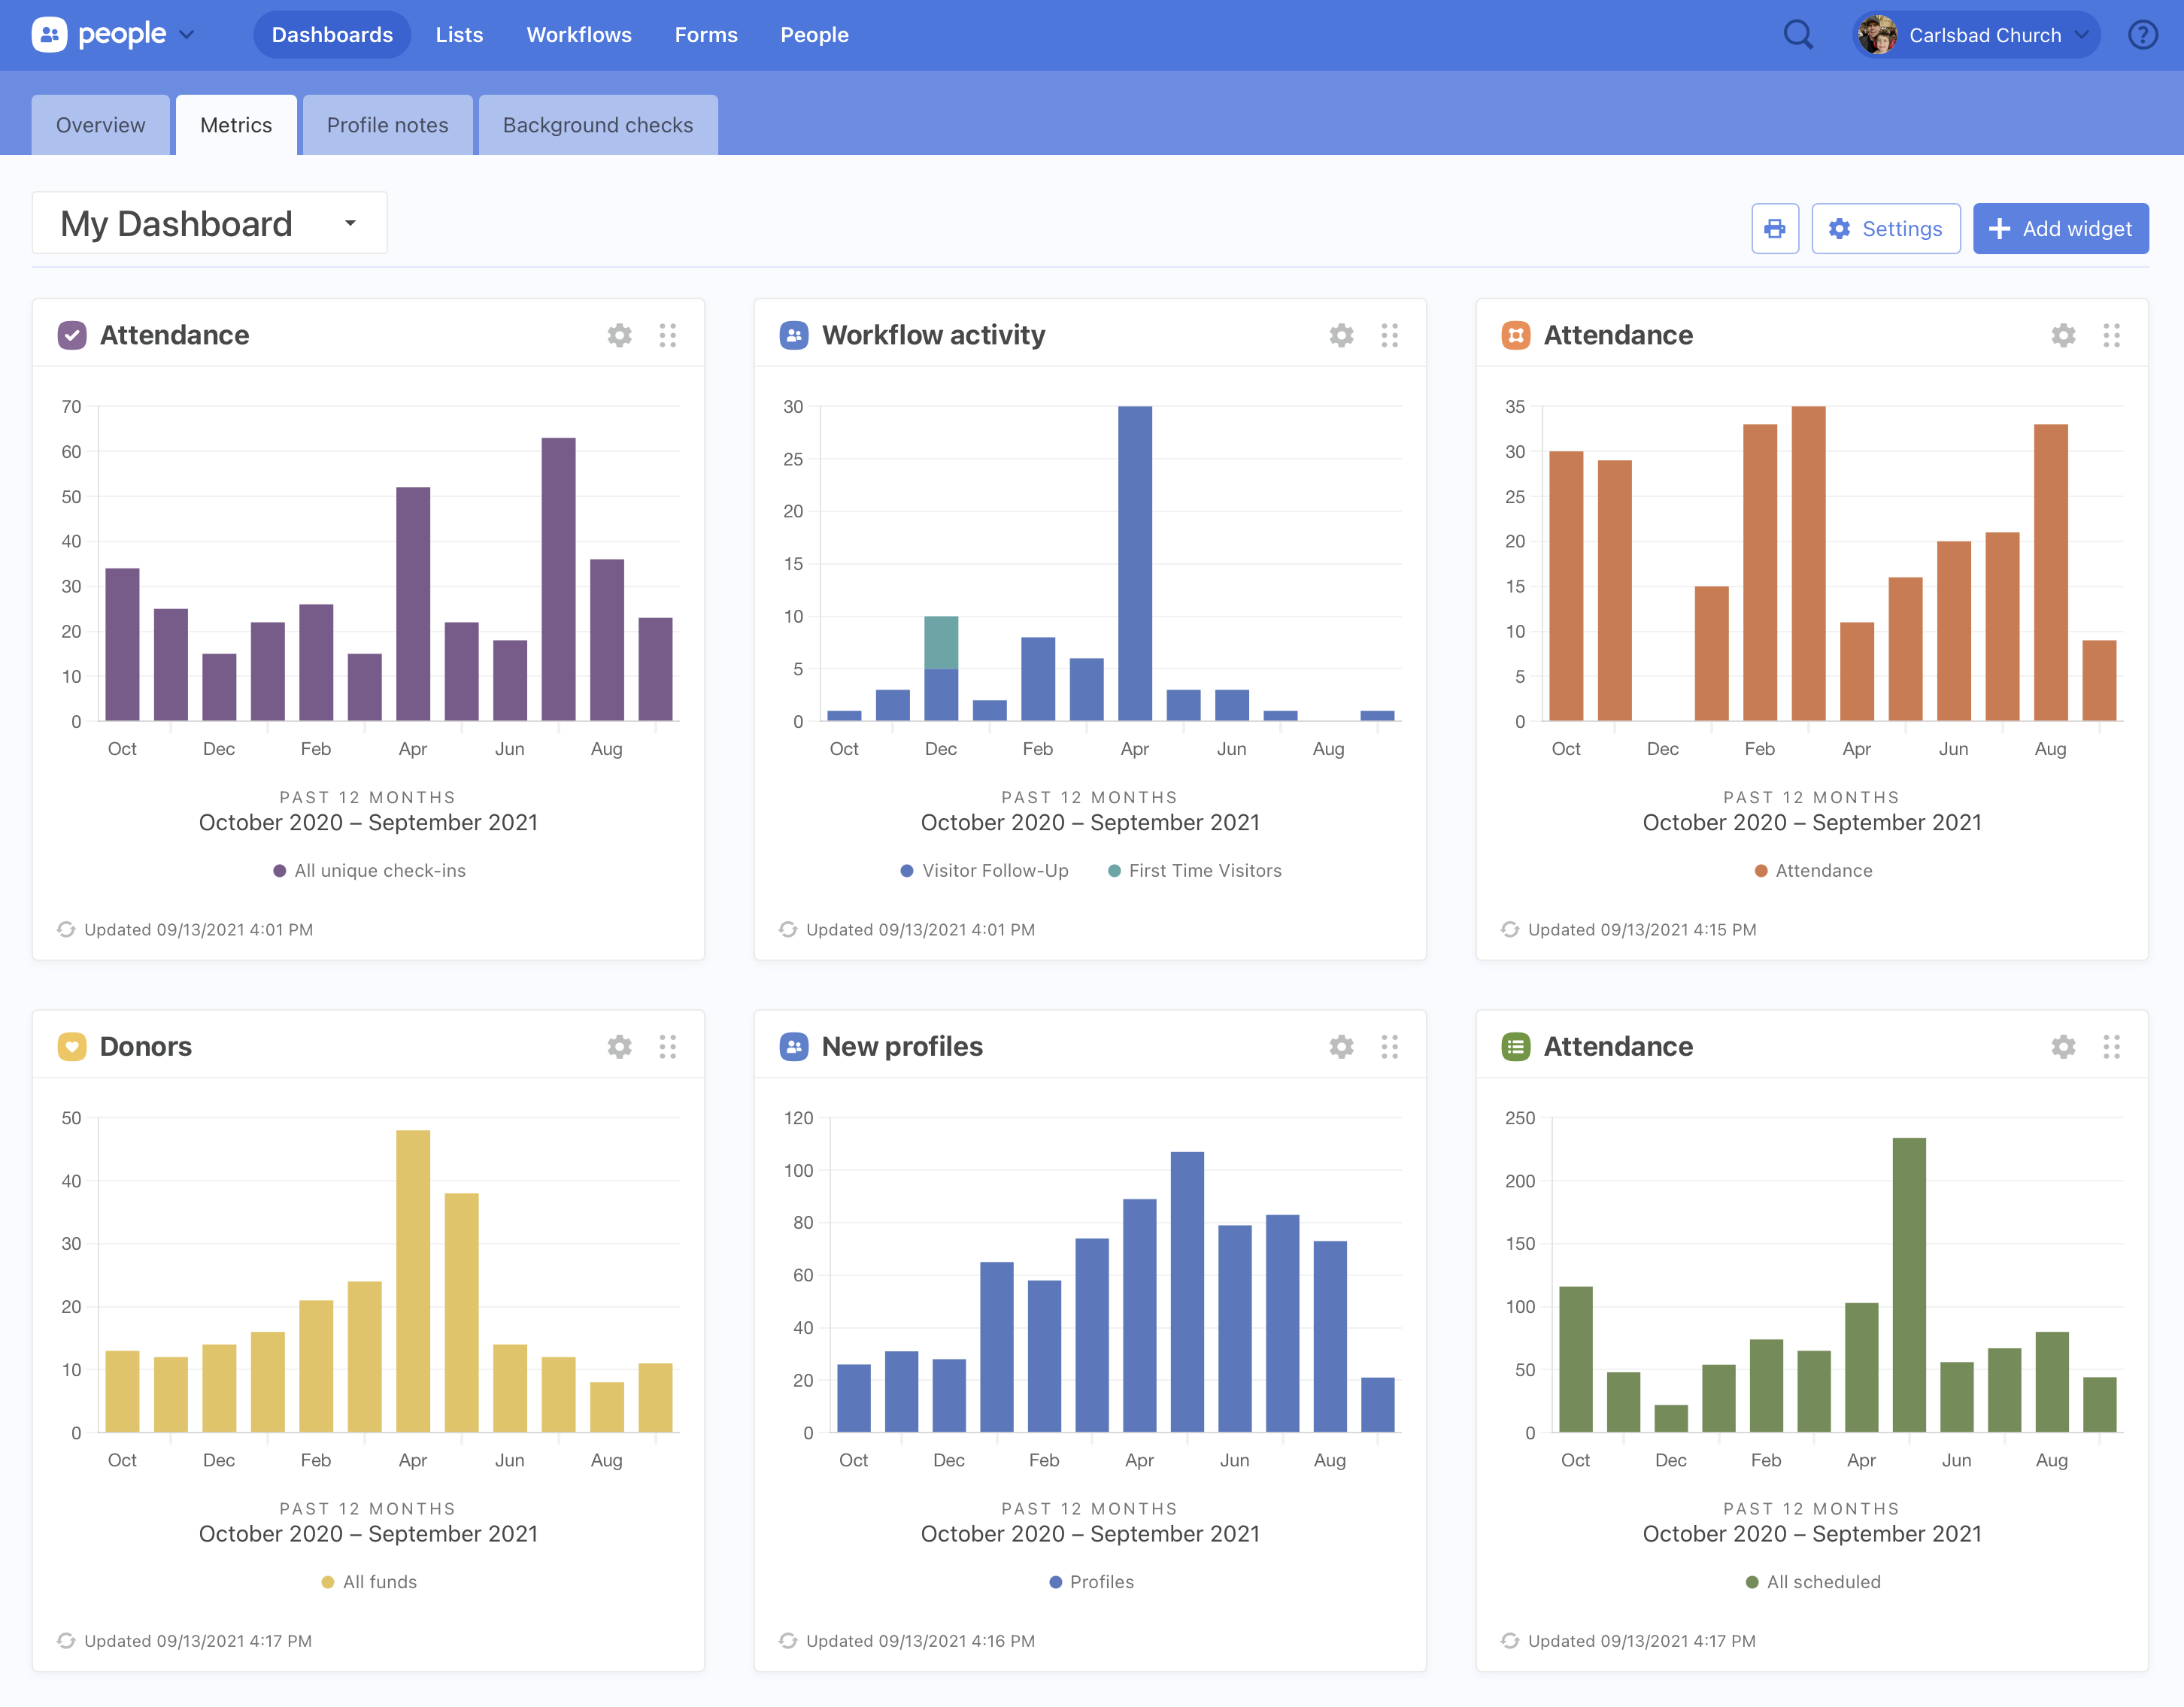
You can get started by clicking on the new “Metrics” tab on the Dashboards tab in People. Once there, create a new dashboard and start adding widgets to it. Each of which will show a specific metric based on how you configure it.
Today there are a dozen different types of trends available to track, including the size of your donor base, new profiles created, attendance from several apps, and many more.
But what’s the point of looking at stats if you can’t show your friends? Each dashboard can be shared with anyone on your team, or even printed out and brought to your staff meeting. Just like lists, when you share a dashboard with someone who doesn’t have access to a certain app, they’ll be able to see that app’s widgets on the dashboard giving them a controlled window into the data you want them to see.
We’d love to hear your feedback! What stats would you like to see on your dashboards? Let us know by clicking on the question mark in the top right of the app.