
We've added three new features to our event graph we think you're going to love:
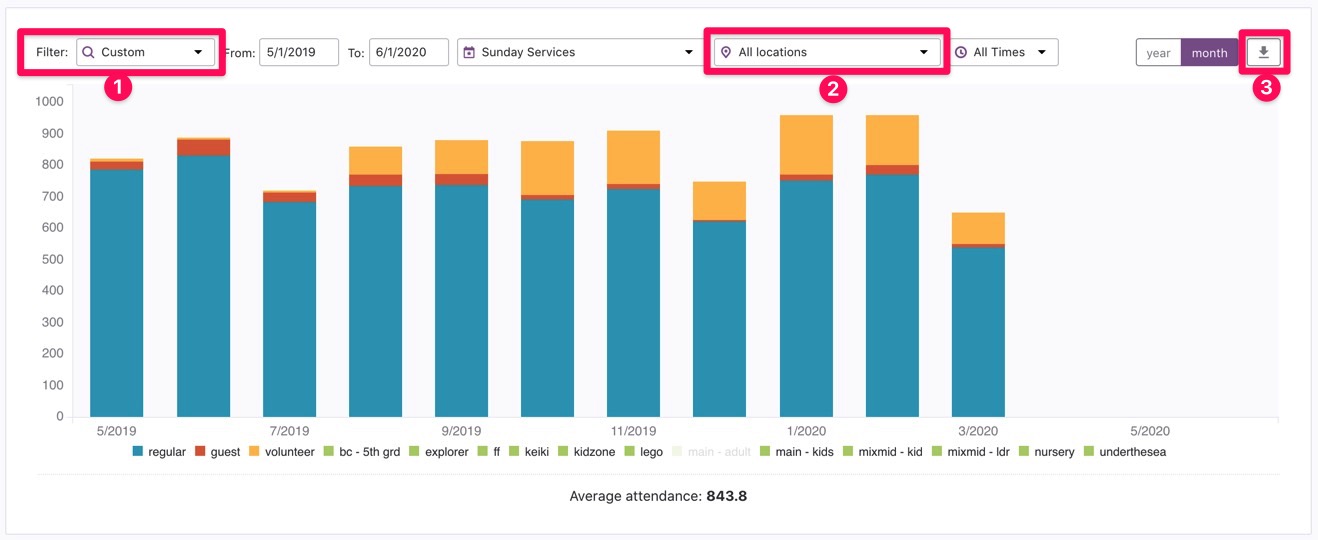
- We added a Custom date range option so you can choose any dates you'd like to see the graph in.
- Filter the graph down to folders and locations to see trends over time for any level of specificity you'd like.
- Download a CSV (to use with programs like Excel or Numbers) of exactly what the graph shows at that time.
Enjoy!
Team Check-Ins